This course introduces students to the field of visualizations. Students will learn basic visualization design and evaluation principles, and gain a broad overview of visualization algorithms and techniques for various types of data and tasks. In a practical design and implementation project, they can develop their analytical abilities and further their programming skills.
Introduction
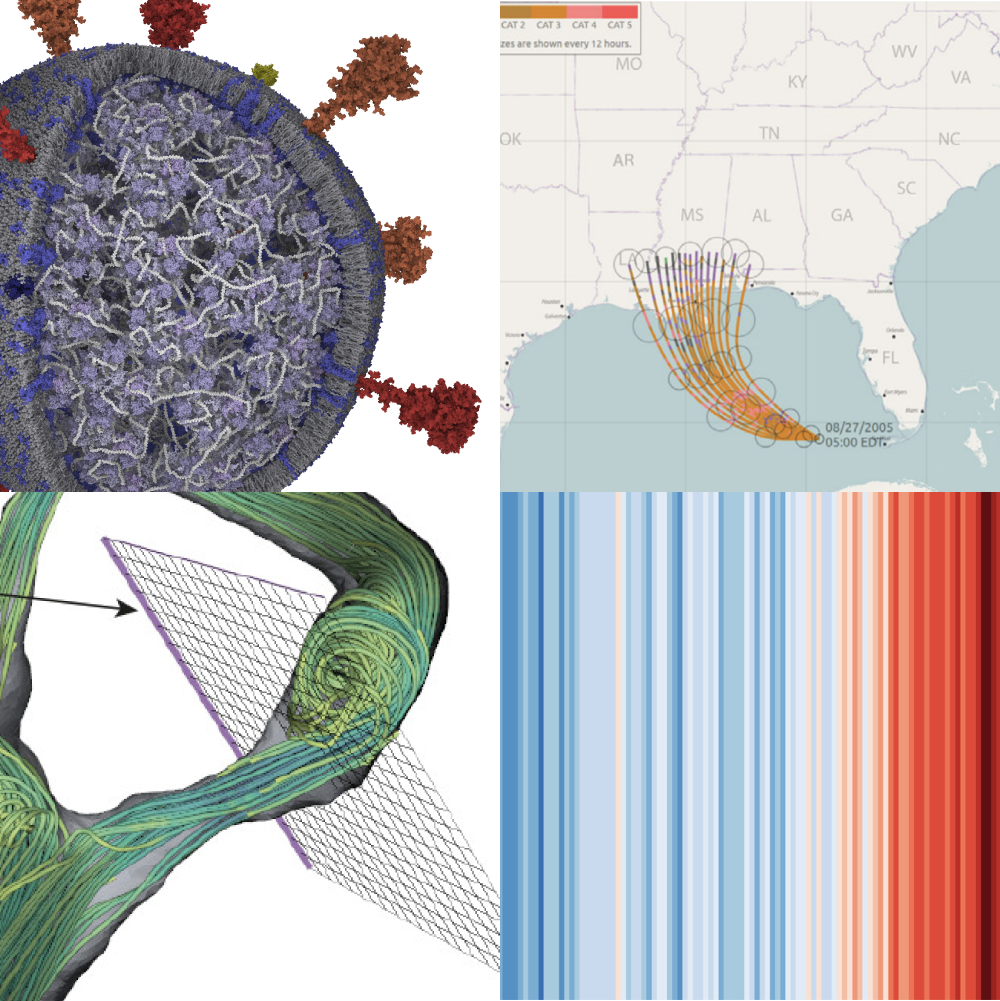
Visualization is the use of interactive graphical representations to provide insight in usually large and complex datasets. The course covers the central aspects of the field of visualization including volume and flow visualization, information visualization, and visual analytics. The application domains of visualization are numerous and multi-faceted, including medical diagnosis and treatment planning, the analysis of biological data, the oil and gas sector, finance, or even the exploration of social networks.
This course aims at teaching a basic understanding of visualization, both in theory and practice. In a combination of lectures, discussions, and the implementation of a visualization project, students of this course learn what visualization is, what visualization is good for, and how visualization is done. The course covers fundamental concepts in visualization analysis design including their perceptual implications. The topics of the course include approaches, methods, and algorithms from information visualization, volume visualization, flow visualization, and visual analytics.
Learning Outcomes
On completion of the course the student should have the following learning outcomes defined in terms of knowledge, skills and general competence:
Knowledge
The student
- has a thorough understanding of the principles of visualization and its subfields
- has knowledge about human perception and how it relates to visualization design
- has an overview of visualization approaches for volume, flow, tabular, network, tree, set, and text data
- has detailed knowledge in methods and techniques for the visualization of scalar and vector fields
- has an understanding of fundamental computational and interactive methods in visual analytics
Skills
The student
- can analyze task requirements and design visualization solutions
- is able to evaluate and communicate visualization design alternatives
- can identify and select visualization techniques appropriate for particular applications
- can realize visualization solutions using modern programming techniques
General competence
The student
- can critically read and discuss scientific papers on a specific topic
- can independently organize, structure, and realize small scale software projects
Required Previous Knowledge
At least 60 ECTS in computer science, preferably including INF100 and INF101 (or a comparable education); MAT101 (or MAT111, or any other comparable course).
Recommended Previous Knowledge
A solid background in (object-oriented) programming, comprised of both knowledge and practical experience, is helpful.
Compulsory Assignments and Attendance
The exercises must be attended. The programming assignments will be evaluated and must be passed. An exam (about the content of the lectures) needs to be passed, as well. Compulsory assignments are valid two semesters, the semester of the approval and the following semester.
Forms of Assessment
Oral exam. The overall evaluation of the course is then a combination of the grading of the programming assignments and the exam.
Grading Scale
The grading scale used is A to F. Grade A is the highest passing grade in the grading scale, grade F is a fail.