2019-05-10
10:15 - 11:15
Visual Computing Forum
Hauke is a Programmer Analyst in the Department of Radiology at the University of California San Diego and is currently working in the MMIV Center at Haukeland hospital. He plays a key role in the development of the data exploration and hypothesis testing portal (Data Portal) used for example in the Pediatric Imaging Neurocognition and Genetics (PING) study, the Alzheimer’s Disease Research Center (ADRC) project, and in the Pediatric Longitudinal Imagine Neurocognition and Genetics (PLING) study. He also contributed in the development of the MagickBox (MB) PACS Network Appliance, which is now in routine use at UCSD, UCLA, and MGH, enabling automated analysis of imaging data using analysis workflows implemented as virtual appliances (docker containers), as part of clinical workflow.
He holds a PhD in computational neuroscience, a master’s degree in computer science and has 10 years of experience working in both commercial enterprises and scientific research with a focus on data analysis and visualization. He has been responsible for software developments in the areas of diffusion tensor imaging, brain perfusion, whole slice image processing and reconstruction, brain mapping and atlas generation, deformable shape models, shape analysis and general numerical simulations.
His research focuses on methods for extracting information from medical image data, histology, genetics, and behavioral data with the goal of understanding processing of development, disease progression and pathology. In the context of large scale clinical studies he combines these diverse sources of information by leveraging tools for data exploration and statistical hypothesis testing.
Abstract:
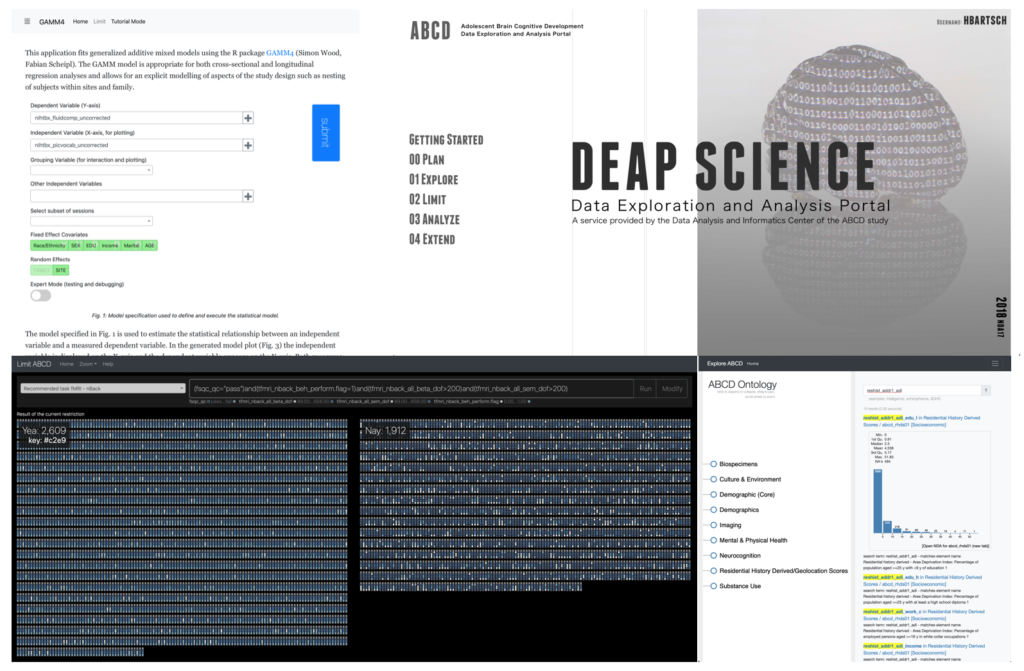
The evolution of data sharing platforms into data analysis systems is driven by the complexity of the analysis required to generate publishable results, the complexity of the data shared and the costs involved in downloading and post-processing data. Using conventional methods to access the imaging data generated with observational studies such as the Pediatric Imaging Neurocogonition and Genetics (PING), the Human Connectome Project (HCP), and the Adolescent Brain Cognitive Development study (ABCD), a researcher needs to download, store, merge, and filter about 8GB of spreadsheet data and 60TB of imaging data. Here we present the Data Exploration and Analysis Portal (DEAP) a collection of visualization based data analysis tools for multi-domain data generated by large research studies.
The application simplifies the access to the spreadsheet data and supports study appropriate statistical analysis using a generalized additive mixed model. Whereas the statistical analysis runs on the server using R (gamm4) all data rendering and filtering are implemented using single page applications on the client computers. Additionally to DEAP we will also present several visual applications for study tracking that use story visualization based data representations (xkcd) to monitor study enrollment and retention, missingness and visit scheduling status